昨日の Meetup の内容をブログにもまとめておきます。本当はこっちを事前に公開したかった。
なお Meetup で話したときの LT 資料はこちら。
Apex Replay Debugger とは
Winter'19 リリースノート:Apex Replay Debugger を使用してすべての組織を無料でデバッグ (正式リリース)
Apex Replay Debugger は VSCode の拡張機能として使える Apex のデバッグ機能です。
Apex を実行した際に出力されるデバッグログファイルを元に、ログファイル出力時の状況を VSCode 上で再現(Replay)できます。
そのため、Apex をステップ実行したり、任意の行にブレークポイントを置いてその時点での変数の状態を確認することができます。
事前に必要なもの Prerequisites
Apex Replay Debugger for Visual Studio Code を参考に必要なものを事前にインストールしておきます。
セットアップ手順
プロジェクトフォルダを作成する
VSCode のコマンドパレット (Mac の場合 Cmd + Shift + P で開く) から
SFDX: Create Project
# または
SFDX: Create Project with Manifest
を実行してプロジェクトを作成します。
または、従来のディレクトリ構成 (src/ の下に package.xml を置き、Force.com Migration Tool などを使ってデプロイ) でも
sfdx-project.json を置きさえすればこの後の VSCode のコマンドを利用することは可能です。
`--src
     `--classes
     `--pages
     `--...
     `--package.xml
`--sfdx-project.json
(その場合、sfdx-project.json の path パラメータは force-app -> src にする必要あり)
起動構成ファイル (launch.json) を作成する
.vscode/launch.json ファイルを作成し、以下をコピペします。
{
  // Use IntelliSense to learn about possible attributes.
  // Hover to view descriptions of existing attributes.
  // For more information, visit: https://go.microsoft.com/fwlink/?linkid=830387
  "version": "0.2.0",
  "configurations": [
    {
      "name": "Launch Apex Replay Debugger",
      "type": "apex-replay",
      "request": "launch",
      "logFile": "${command:AskForLogFileName}",
      "stopOnEntry": true,
      "trace": true
    }
  ]
}
もし、プロジェクトごとに設定するのが面倒な場合、ユーザー設定に "launch": ... という設定を追加することでも可能のようです。

このあたりは VSCode のドキュメントが参考になります。
https://vscode-doc-jp.github.io/docs/userguide/debugging.html#起動構成
デバッグログレベルを FINEST にする
Replay Debugger を実行するためには、デバッグログレベルを
VISUALFORCE:FINERorFINESTAPEX_CODE:FINEST
に設定する必要があります。
これは、VSCode 上で
SFDX: Turn On Apex Debug Log for Replay Debugger
というコマンドを実行することで変更できます。
Replay Debugger の使い方
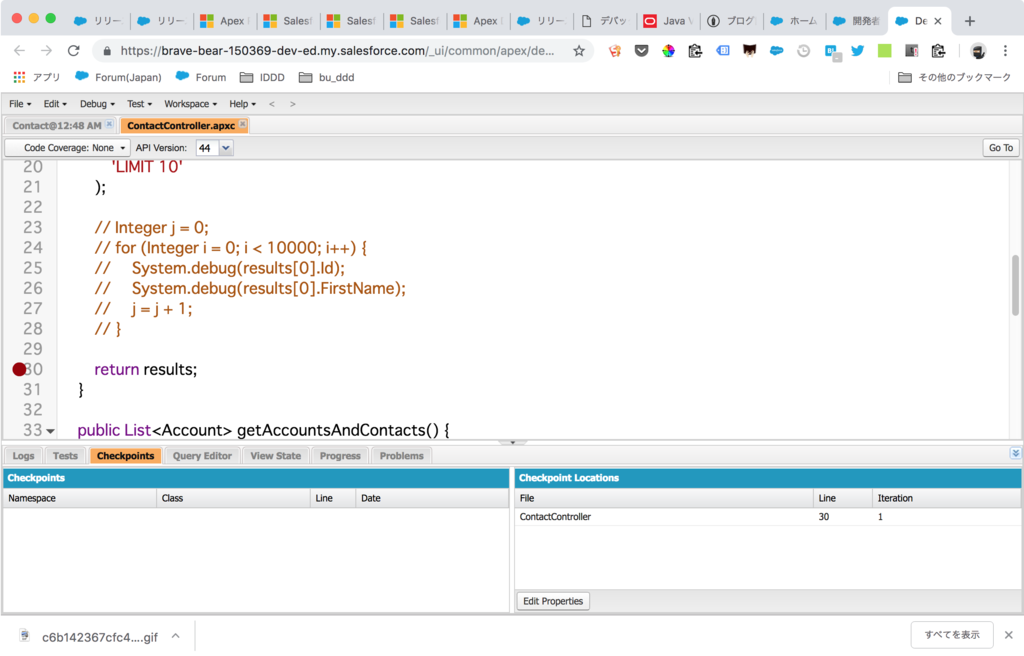
ソースコード上に Checkpoint を置く
処理を中断したりその時点での変数の状態を確認したい行にカーソルを置き、
SFDX: Toggle Checkpoint
を実行します。
行番号の左に赤いマークがつくのがわかります。これを Checkpoint と呼びます。

Checkpoint を組織に反映させる
設置した Checkpoint は組織に反映させる必要があります。
事前に Scratch Org を作成したり、 sfdx force:auth:web:login などで認証を済ませておいてから
SFDX: Update Checkpoints in Org
を実行します。Output パネルに
Starting SFDX: Update Checkpoints in Org
SFDX: Update Checkpoints in Org, Step 1 of 6: Retrieving org information
SFDX: Update Checkpoints in Org, Step 2 of 6: Retrieving source and line information
SFDX: Update Checkpoints in Org, Step 3 of 6: Setting typeRefs for checkpoints
SFDX: Update Checkpoints in Org, Step 4 of 6: Clearing existing checkpoints
SFDX: Update Checkpoints in Org, Step 5 of 6: Uploading checkpoints
SFDX: Update Checkpoints in Org, Step 6 of 6: Confirming successful checkpoint creation
Ending SFDX: Update Checkpoints in Org
のように出力されれば成功です。
ちなみにこれは、開発者コンソールでエディタを開き、Checkpoint を設置したのと同じことをやっています。
Apex を実行する
Checkpoint を設置した Apex コードを実行します。
実行にはいくつか方法がありますが、好きな方法で OK です。
- Visualforce ページなどで使われている Apex の場合、画面を直接操作する
- 該当の Apex のテストコードを実行する
- Execute Anonymous Window などで実行する
余談ですが特に VSCode を使った開発の場合、2 に関してはテストクラスを開くとメソッドの上に Run Test というリンクが表示されており、そこからメソッドごとにテストを実行させることができたり

3 に関しては、適当なスクリプトファイルを作成し、開いた状態で
SFDX: Execute Anonymous Apex with Editor Contents
を実行すれば、開発者コンソールでの Open Execute Anonymous Window とほぼ同等のことを行えて便利です。
デバッグログファイルを取得する
Apex を実行したら、その時のログファイルをローカルにダウンロードします。
これについても VSCode 上で
SFDX: Get Apex Debug Logs...
を実行すると、新しい順にデバッグログの一覧が表示されるので、そこから選択するとダウンロードすることができます。

ログは .sfdx/tools/debug/logs/ の下に保存されます。
デバッグログファイルから Replay Debugger を起動する
該当のログファイルを開いた状態で、コマンドパレットまたは右クリックして表示されるメニューから
SFDX: Launch Apex Replay Debugger with Current File
を実行します。
ログパネルが開き、またログファイルの1行目に黄色いカーソルが表示され、デバッグ用のメニューが表示されます。
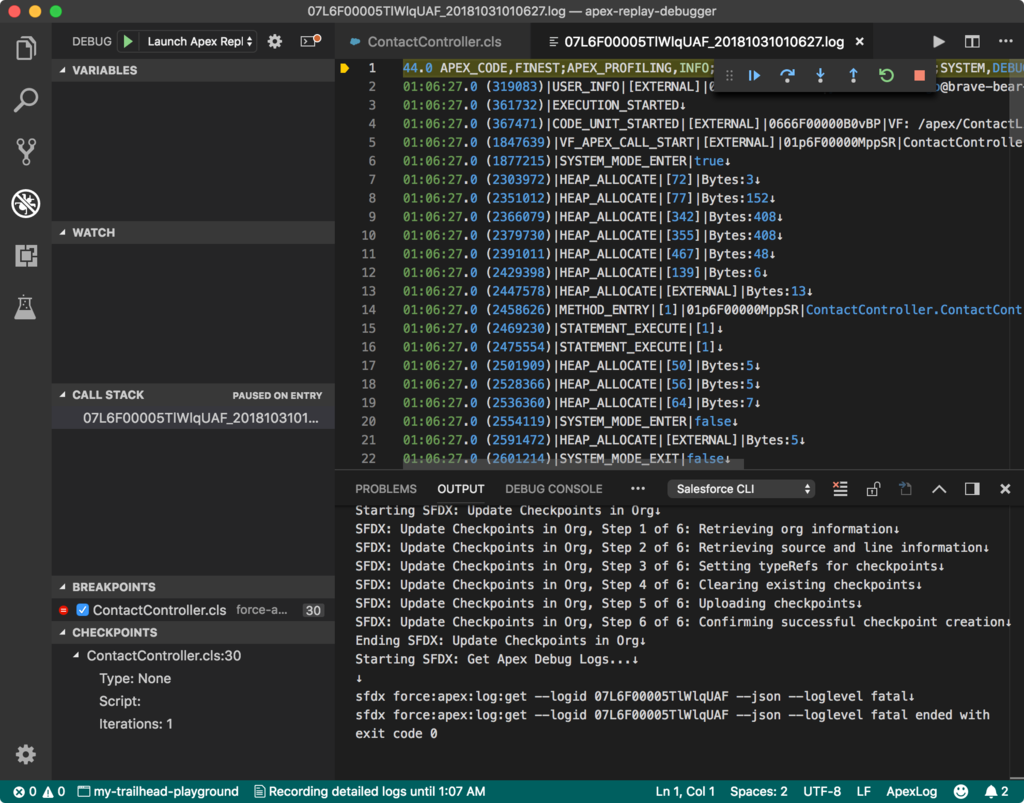
デバッグ:Apex をステップ実行したり、変数の中身を覗いてみる
この状態で |▶ ボタン (Continue: F5) を押すと、先ほどの Checkpoint まで処理が進み、該当行でストップしていることがわかります。
左側の VARIABLES ペインを見ると、この時点での変数に格納されている値を確認することができます。

また、行番号の左のスペースをクリックすることで、 Checkpoint を設置した行以外の行にも Breakpoint を設置することができます。
次にデバッガを実行したときにはこの Breakpoint でも処理が中断されるようになります。
(Checkpoint と Breakpoint の違いは後述)
注意事項
今のところ以下の制約があるようです。
- Checkpoint は最大5個まで。また有効期限は30分
- 一度に実行できるのは1個のログファイルまで
- そのため、非同期処理などのデバッグは注意が必要
詳細は Apex Replay Debugger の「Considerations」の項 を一読されることをおすすめします。
その他
Checkpoint と Breakpoint
SFDX: Toggle Checkpoint を使い、また組織にもデプロイした Checkpoint と、VSCode 上だけで定義した Breakpoint は、できること(得られる情報)が異なります。
「Set Breakpoints and Checkpoints」 や「Considerations」 あたりを読む限り、以下のような違いがあるようです。
For more information than line breakpoints provide, add checkpoints. You can set up to five checkpoints to get heap dumps when lines of code run. All local variables, static variables, and trigger context variables have better information at checkpoints. Trigger context variables don’t exist in logs and are available only at checkpoint locations.
トリガーのコンテキスト変数をはじめとして、Checkpoint の方が持っている情報が多いみたいです。
- Long string variable values are truncated at breakpoints. At checkpoints, heap-dump-augmented variables have full strings.
- When viewing a standard or custom object at a breakpoint, you can drill down only to the object’s immediate child variables (one level deep). At checkpoints, heap-dump-augmented variables have full drill-down to child standard objects, not only to immediate children.
Checkpoint の方が長い文字列も省略されなかったり、ネストしたオブジェクトの情報なども完全に保持しているらしい。
Apex Debugger との違い
名前がややこしいですが、VSCode の拡張機能として Apex Debugger というのもあります。
ただ、こちらは
This extension enables VS Code to use the real-time Apex Debugger with your scratch orgs and to use ISV Customer Debugger with your subscribers’ sandbox orgs.
というところから対象組織は Scratch Org (および ISV 向けの機能については Sandbox Org) に限定されたり、
- One Apex Debugger session is included with Performance Edition and Unlimited Edition orgs.
- To purchase Apex Debugger sessions for Enterprise Edition orgs, or to purchase more sessions for orgs that already have allocated sessions, contact Salesforce.
から Performance Edition, Unlimited Edition 以外では有償のようです。